Een bijdrage van Marcel Crok.
Onlangs hield John Christy, Distinguished Professor of Atmospheric Science en directeur van het Earth System Science Center aan de Universiteit van Alabama in Huntsville, een online lezing voor het Irish Climate Science Forum.
Het evenement werd georganiseerd door Jim O’Brien, die ook de Ierse ambassadeur van CLINTEL is. Ondertekenaars van CLINTEL’s Wereldklimaatverklaring World Climate Declaration van over de hele wereld (van Australië tot Chili) woonden de bijeenkomst bij en Christy erkende dat dit waarschijnlijk de eerste keer was dat hij een presentatie gaf voor een wereldwijd publiek.
Christy sprak in 2019 in Dublin in 2019 en in deze nieuwe lezing gaf hij een update van zijn lopende onderzoek naar het testen van klimaatmodellen. De lezing is opgenomen en staat online (wachtwoord S+R$j6N%) vergezeld van een transcriptie van zijn gesproken tekst.
Christy en zijn collega Roy Spencer behoren tot de bekendste klimaatsceptici ter wereld. Christy was – als een van de weinige sceptici – betrokken bij verschillende IPCC-rapporten en hij is een deskundige reviewer van het aanstaande zesde IPCC-rapport.
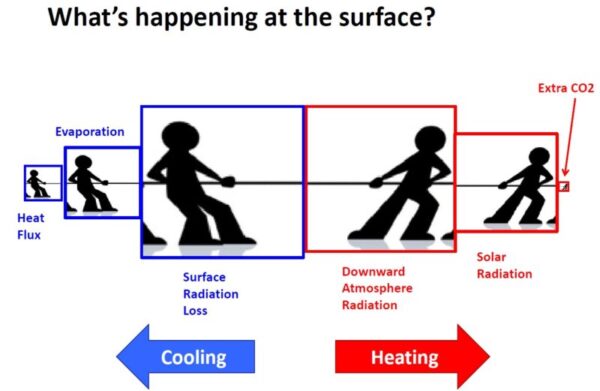
In het begin van de lezing beklemtoonde Christy de enorme uitdaging van klimaatwetenschap: het inschatten van de klimaatinvloed van een vrij kleine kracht (extra CO2) in een enorm en ingewikkeld klimaatsysteem. Hij liet deze grafiek zien om dit punt te verduidelijken:
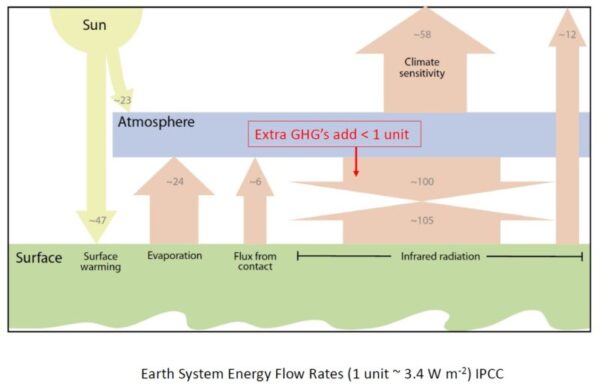
In dit vereenvoudigde beeld van de energiestromen van de aarde voegen de extra broeikasgassen minder dan één eenheid energie toe aan het oppervlak op een totaal van 100 eenheden energie. Dat brengt Christy op de afbeelding bovenaan deze post waar twee teams betrokken zijn bij een touwtrekken en waar het “verwarmingsteam” een beetje hulp krijgt van de extra CO2.
De belangrijkste taak van een wetenschapper is het testen van hypothesen, zei Christy, en in het geval van klimaatverandering is de uitdaging om een geschikte en toetsbare hypothese te vinden. Omdat klimaatwetenschappers al hun kennis bundelen in klimaatmodellen, moeten de modellen worden getest. Christy presenteerde vier criteria voor deze test:
1. De respons wordt in alle modellen gezien als een dominante eigenschap.
2. Reactie is er niet als extra broeikasgassen niet worden meegerekend (controle en experiment zijn altijd verschillend).
3. De metriek kan niet zijn gebruikt bij de tuning en ontwikkelen van het model.
4. Waarnemingen moeten afkomstig zijn uit meerdere, onafhankelijke bronnen.
Hoewel de wereldwijde gemiddelde oppervlaktetemperatuur door velen wordt beschouwd als de belangrijkste maatstaf om klimaatverandering te beoordelen (en wordt gebruikt door de Overeenkomst van Parijs om een internationale drempel te bepalen), is die maatstaf niet geschikt om de modellen te testen, omdat de modellen al daarop zijn getuned (criterium 3).
Christy en collega’s besloten dat het meest opvallende kenmerk van alle modellen een sterke opwarming is hoog in de tropische troposfeer, ook wel de tropische hotspot genoemd. Deze functie verschijnt in alle modellen en verdwijnt wanneer de forcering wordt uitgeschakeld. Deze opwarming had ook al moeten plaatsvinden in de periode 1979-2019 en kan daarom worden getoetst aan waarnemingen van weerballonnen en satellieten.
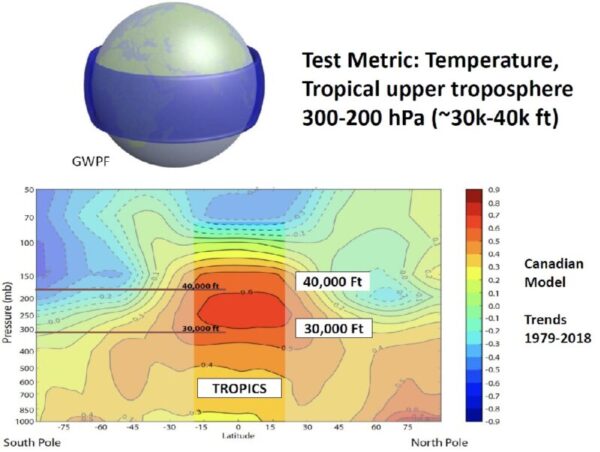
Hier is het Canadese model, maar alle andere modellen tonen deze uitgesproken opwarming hoog in de tropen. Direct naar de resultaten. Christy presenteerde voor het eerst een vergelijking tussen AR6-modeltrends en observaties:
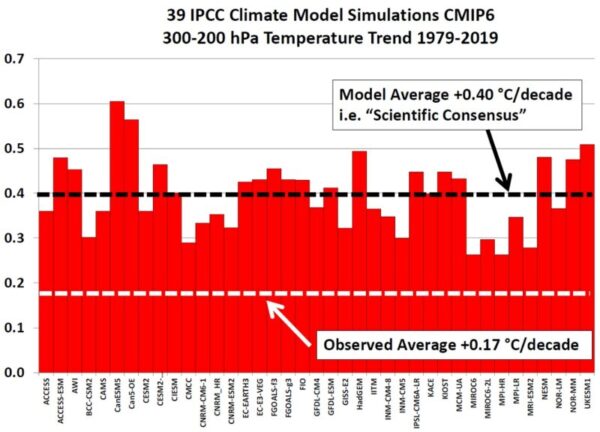
Zoals te zien valt, vertonen alle modellen aanzienlijk meer opwarming dan waargenomen en gemiddeld is het verschil een factor bijna 2,5. Christy toonde ook plots voor alle individuele modelruns, zowel van CMIP5 als CMIP6. Eerst CMIP5:

Het verschil tussen de gemodelleerde en waargenomen trends in deze grafiek werd getest door de Canadees Ross McKitrick en Christy in een paper uit 2018 en zoals hij hier laat zien met een opmerking in de grafiek, zijn ze niet geslaagd voor de test. Modellen en observaties komen dus niet overeen en het verschil tussen beide is groot. Daarom is de hypothese fout!
In CMIP6 is de situatie iets anders:
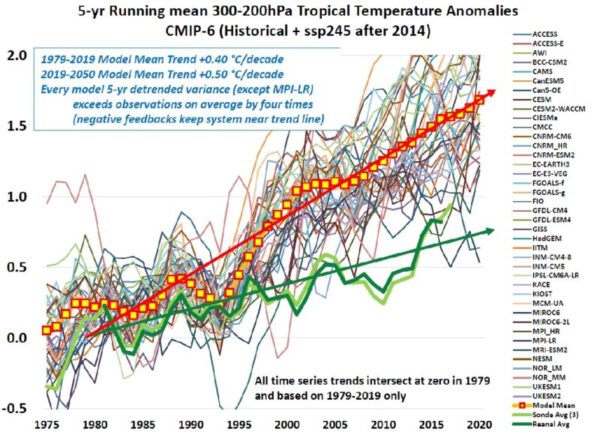
Er is een opvallend verschil tussen CMIP5 en CMIP6. De variabiliteit van de modellen nam toe, ze stuiteren op en neer en veel meer dan de waarnemingen. Christy zei dat dit aangeeft dat de modellen negatieve feedbacks onderschatten die in het echte klimaatsysteem werken. Modellen, wanneer ze opwarmen, laten niet genoeg warmte naar de ruimte ontsnappen. Het echte klimaatsysteem heeft een effectiever koelmechanisme dan de modellen.
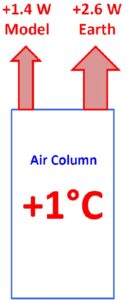
Dat was ongeveer de belangrijkste boodschap van de lezing. Modellen slagen nog steeds niet voor de test. Onthoud dat deze modellen alle fysieke kennis van de huidige klimaatwetenschappelijke gemeenschap bevatten en nog steeds niet in staat zijn om fundamentele energiestromen te reproduceren.
In de rest van de lezing besprak Christy vele andere aspecten van het klimaatdebat: klimaatgevoeligheid, trends in extremen (geen!), trends in zee-ijs en sneeuwbedekking en hij liet een aantal interessante grafieken zien over zeespiegelveranderingen.
De hele lezing is uw tijd meer dan waard.


“33 Simple Bullet Points proving ‘Global Warming’ is caused by the Sun, not CO2 — by a geologist
Dr Roger Higgs (DPhil geology, Oxford, 1982-86)
Geoclastica Ltd and ResearchGate (click here for links to sources)
Abbreviations:
‘AD’ = anno Domini
‘BC’ = years ‘before Christ’
‘BP’ = years ‘before present’, from radiocarbon dating. 0 is 1950AD by convention
~ = about/approximately
1) The IPCC (United Nations Intergovernmental Panel on Climate Change) has no geologists among the hundreds of authors of its last major report (2013-14) and at most 1 geologist in the next report (due 2022; see my Technical Note 2019-10). Thus IPCC focuses on only the last 170 years (since multiple reliable thermometer measurements began, ~1850), yet Earth is 26 million (sic) times older, 4.5 billion years. Geologists know that throughout this time Earth has constantly warmed or cooled (never static). Thus ‘climate change’ is nothing new; it is perfectly usual. During the last 11,650 years, our current ‘Holocene’ interglacial epoch, climate change has repeatedly been fast enough to cause collapse of civilisations (Bullet 20).
2A) The IPCC’s very existence relies on public belief in ‘Anthropogenic (man-made) Global Warming’ (AGW) by CO2 emissions. Most IPCC authors, mainly government and university researchers, are biased by strong vested interests in AGW (publications; continuance of salaries; research grants).
2B) Similarly, universities have sacrificed their impartiality by hosting institutes financially mandated to promote AGW. For example, London’s former bastion of scientific integrity Imperial College has, since 2007, housed the ‘Grantham Institute – Climate Change and the Environment’, founded and funded by investment magnate Jeremy Grantham (heavily involved in forest destruction for biomass energy according to the 2019 Michael Moore/Jeff Gibbs documentary ‘Planet of the Humans’). The ‘Tyndall Centre for Climate Research’ (founded 2000) has branches at the Universities of Cardiff, Manchester, Newcastle and Fudan, and also at the University of East Anglia, in the same building as the infamous IPCC-linked Climatic Research Unit (CRU; Wiki ‘Climategate’).
2C) Well-known scientists formerly associated with the IPCC have subsequently denounced its methods.
3) Claimed ‘97% consensus among scientists’ that AGW exists is a deception. It refers in fact to polls of recent publications by only ‘climate scientists’, i.e. atmospheric specialists, lacking deep-time perspective (Bullet 1), who deal with ‘climate models’ (Bullet 6). Graduation and employment of ‘climate scientists’ opportunistically boomed in the AGW hysteria since 1990, lavishly funded, creating a strong incentive for bias (Bullet 2). The vast majority of the world’s normal scientists, numbering millions and lacking any financial bias, are not part of the ‘consensus’, having never been polled, myself included. In November 2019 Wikipedia deleted its “List of scientists who disagree with the scientific consensus on global warming” (Bullet 29).
4) No informed person ‘denies’ global warming: it has been measured (Bullet 11). ‘Global-warming denier’ is a deceitful term, with intentionally despicable connotations, for doubters and deniers of ‘Anthropogenic (man-made) Global Warming’ (AGW), probably the majority of the world’s scientists.
5A) The “greenhouse effect … a slight misnomer” (Wiki; in fact a complete misnomer; see their references) … “is the process by which radiation from a planet’s atmosphere warms the planet’s surface” (Wiki, citing IPCC). This bold claim that Earth’s land- and ocean surfaces are warmed by the air is ‘backwards’. In truth the (solar-warmed) ocean warms the atmosphere, as shown by two observations: (1) ocean-surface water (covering ~70% of Earth) is almost everywhere warmer (fractionally) than the air above it; and (2) changes in global average surface air temperature lag 1 to 1.5 months behind corresponding changes in global sea-surface temperature. These two facts indicate that heat (only capable of flowing one way, from warmer to cooler) flows outward, from the ocean to the air, not vice versa. A truthful summary of the greenhouse effect is that solar energy absorbed at Earth’s surface is radiated back into the atmosphere as heat, some of which is absorbed on its way out to space by greenhouse gases. Thus greenhouse gases cause no warming; instead they reduce the air’s heat loss to space.
5B) CO2 is a ‘greenhouse gas’ (GHG). Due to the ‘saturation effect’, CO2’s theoretical heat-trapping ability sharply (logarithmically) declines as its concentration rises. CO2’s Climate Sensitivity (CS) is the hypothetical warming due to a doubling of CO2. IPCC ‘estimates’ CS, based on defective (Bullet 6) climate models (circular reasoning), as probably between 1.5 and 4.5C°, a 300% contrast! According to a landmark new paper by van Wijngaarden & Happer (2020), CS for doubling from 400 to 800ppm is theoretically 1.4 to 2.3C°, but their calculations assume cloud-free conditions; the effect of clouds, which cover about two-thirds of Earth at any moment (Wiki ‘Cloud cover’), is very uncertain (Bullet 5C).
5C) Despite CO2’s greenhouse-warming potential, evidently the Sun (not CO2) governed our climate for at least the last 2,000 years, based on good correlation between solar-magnetic output (SMO) and Earth’s average surface temperature (Bullet 12), in contrast to CO2’s non-correlation (Bullet 12B) except the partial coincidence (by chance) of its strong rise since 1850 (start of Industrial Revolution) versus ‘Modern Warming’ (1815 to present-day; Bullet 11) and SMO’s ~1700-1991 surge. This proves that CO2’s greenhouse-warming potential, already fallen logarithmically “well into the saturation regime”, is negated by feedbacks. Two natural feedbacks ignored in IPCC climate models are: (i) little known cloud feedback; and (ii) “potentially very important” increased biogenic ‘BVOC’ aerosol due to faster forest growth by warming & CO2 fertilization. (The only feedbacks listed in IPCC’s influential 2013 Fifth Assessment Report figure SPM.5 are man-made ones, with very wide “uncertainty intervals”.) IPCC admits “aerosols and their interactions with clouds have offset a substantial portion of global mean forcing from … greenhouse gases. They … contribute the largest uncertainty”; and “quantification of cloud and convective effects in models, and of aerosol–cloud interactions, continues to be a challenge.” IPCC’s underestimation of negative feedbacks explains why climate models run too hot (Bullet 6), and why ‘runaway’ warming has apparently never occurred on Earth.
6A) Computer ‘climate models’ (by ‘climate scientists’; Bullet 3) are so full of assumptions (stacked upon other assumptions) as to be highly misleading at best, e.g. 1985-2015 warming forecast by 31 models turned out 2 to 4 times too high. Even pro-IPCC ‘tricky Wiki’ (Bullet 29) admitted: “Each model simulation has a different guess at processes that scientist don’t understand sufficiently well”.
6B) Climate models ignore three crucial factors: (i) natural cloud and aerosol-cloud feedbacks (Bullet 5C); (ii) large changes in solar magnetic output (SMO; Bullet 12A), driving global temperature changes according to the Svensmark Theory, denied by the IPCC (Bullet 14), which disingenuously says ‘total solar irradiance’ (TSI; varies in step with SMO but proportionally far less) varies much too little to affect climate, so CO2 must be in charge; likewise the CRU (Bullet 2B); and NASA, which went so far as to publish ‘Atmospheric CO2: Principal Control Knob Governing Earth’s Temperature’ in 2010; (iii) ‘ocean-lag’, the multi-decade delay between changes in SMO and correlative changes in temperature (Bullet 21). These three IPCC failings, ‘Sun denial’, ocean-lag omission, and feedback underestimation, render climate modelling conducted to date worthless.
7A) For much of the last 550 million years (Phanerozoic time), atmospheric CO2 was 2 to 10 times higher than now. Evolution flourished. Plant photosynthesis, the basis of all life, was stimulated by higher CO2 (Bullet 8). Extinction events due to overheating by CO2 are unknown.
7B) Throughout Phanerozoic time, CO2 seemingly correlated well with temperature (although all studies inevitably have low resolution). This is readily explained by warming oceans releasing CO2 and vice versa (Bullets 9, 10).
8A) Through Holocene time, atmospheric CO2 was a mere 250-285 ppm (i.e. near plant-starvation level of ~150 ppm; Wiki ‘CO2 fertilization effect’; also Bullet 27), until ~1850 when mankind’s industrial CO2 emissions began. Since then, atmospheric CO2 has climbed steeply. Proving that man’s emissions are the main driver of this post-1850 rise in CO2, ice cores show that the last five interglacial periods (including the Holocene) all reached levels of 250-300 ppm, i.e. a sort of ‘equilibrium’ value. CO2 today (January 2021), 415 ppm, is still only 0.04% of our atmosphere (i.e. less than half of one-tenth of 1%), far less than in the past (Bullet 7).
8B) The present CO2 level of 415ppm is far from hazardous to human health, e.g. CO2 levels in American Navy submarines typically average 3,000-4,000ppm with no reported ill effects. Benefits of rising CO2, thanks to the ‘CO2 fertilization effect’, include expansion of natural forests (‘greening’ of the planet) and increased agricultural productivity, essential for feeding Earth’s burgeoning population. Thus, ironically, man’s production of CO2 by burning fossil fuels (for energy and transport) has unintentionally averted, or at least postponed, a global food crisis. Commercial growers inject CO2 into their greenhouses. “CO2 enrichment in greenhouses allows crops to meet there (sic) photosynthesis potential.” “For most crops the saturation point will be reached at about 1,000–1,300 ppm … Increased CO2 levels will shorten the growing period (5%–10%), improve crop quality and yield”.
9) Until man began adding industrial CO2 about 1850, global warming (determined from ‘proxies’ like tree rings) since the ~1815 cold peak of the Little Ice Age (~1250-1920) was accompanied by a very slight rise in CO2 (measured in ice cores). A simple explanation is the well-known release of CO2 by warming ocean water (decreasing its CO2-holding capacity).
10) Other evidence, besides Bullet 9, that rising CO2 is a consequence, not cause, of global warming is that Quaternary glacial-interglacial temperature changes were followed “very closely” by changes in CO2. Based on ice-core data, the time-lag is somewhere between 400 years and zero, possibly even slightly negative. However, based on direct thermometer and CO2 measurements covering the last few decades, changes in CO2 lag behind ~5 months according to Kuo et al. (1990) and 11-12 months according to Humlum et al. (2013).
11) Thermometer records since 1750 show 2.1C° warming (global land average) since 1815 (Little Ice Age nadir; Bullet 9). This ‘Modern Warming’ (name proposed here) was interrupted by two 30-year coolings (1880-1910, 1945-1975, 0.2C° each) and the 1998-2013 ‘Global warming hiatus’ (Wiki); and by frequent brief (1-3 years) minor coolings, some attributable to mega-volcano ‘winters’ (1-10years) and perhaps to El Niño/La Niña events (seldom if ever exceed 2 years). After the first 30-year cooling, global average warming was 1.3C° from 1910 to 2016 (slight cooling since then [Bullet 13]). In contrast, since the start of industrial CO2 additions ~1850 (Bullet 8), CO2’s rise has accelerated, with only a brief pause (1887-97) and a mini-reversal (1940-45), both during the 30-year coolings, and both attributable to CO2’s increasing solubility in a cooling ocean (Bullet 9). The 30-year coolings match solar-output downturns, after applying a temperature lag of ~100 years due to ‘ocean memory’ (Bullet 21). There is no other viable explanation.
12A) This unsteady ‘sawtooth’ (up-down) style of post-1815 ‘Modern Warming’ (Bullet 11) mimics the sawtooth rise in solar-magnetic output (SMO) from ~1700 (end of sunspot-defined ‘Maunder Minimum’) to 1991 (peak of SMO Sun’s modern ‘Grand Maximum’ [GM; 1937-2004]; NB sunspot peak was earlier, 1958). A good cross-match is obtained by applying a temperature delay of ~100 years (‘ocean-lag’; Bullet 21), thereby aligning the two 30-year coolings (Bullet 11) with two solar declines. SMO’s ~1700-1991 surge was both the strongest (amplitude) and highest in at least 9,000 years, increasing 350% from 1700 to 1950 and, in the 20th Century alone, 131% from 1901 to 1991, and 41% from 1964 to 1996. “The last period which showed similar high activity and also lasted as long as the current one was about 1700 years ago” (Steinhilber et al. 2008). That particular ~300AD GM caused warming (and drove a global 2-3m sea-level rise, the ‘Romano-British Transgression’, portending another such rise imminently (Bullet 24). Thus I propose that the Sun drove Modern Warming (via the Svensmark cosmic ray/cloud mechanism [Bullet 14]), with negligible or no help from CO2, in the same way that earlier (lesser) GMs of the last 8,000 years clearly correlate with (lesser) warmings (Bullet 12B).
12B) Similarly, since at least 2,000 years ago, solar-magnetic output (SMO) correlates well with temperature (proxy temperatures from tree rings, ice cores, etc. in the pre-thermometer era before 1750). Both graphs have a hockey-stick shape (Bullet 32): the ‘shaft’ is an overall ~1,200-year decline from ~400AD to the Little Ice Age (LIA; Bullet 9), with superimposed 50-200-yr smaller up-down ‘sawteeth’; the ‘blade’ is the post-1700 surge (Bullet 12A). Applying a temperature lag of ~100-150 years (Bullet 21) aligns: (i) the Sun’s ~300AD GM (Bullet 12A) and the ~450AD highest temperature of the last 2,000 years (possibly surpassed by Modern Warming); and (ii) the ~1700 LIA solar minimum and the 1815 LIA minimum temperature (Bullet 12A). Moreover, the graphs have the same proportionality: ~3:2 ratio of surge height versus sawtooth amplitude; and ~1:1 height ratio of the shaft and blade. In contrast, CO2’s correlation with temperature for the last 2,000 years is very poor: the only (partial) match is CO2’s surge since ~1850 (start of Industrial Revolution). CO2 mismatches are: (i) slight overall rise from 500AD into the LIA (i.e. ‘shaft’ gradient is backwards); (ii) sawteeth are minuscule; and (iii) the two 30-year solar- and temperature declines (Bullet 12A) are missing. Further back in time, despite decreasing proxy availability and looser dating, correlation is also evident for at least the last 8,000 years, superimposed on long-term slight cooling due to Earth’s declining axial obliquity since ~8,500BP (google Milankovitch orbital forcing).
13) 2016 was the warmest year ‘since records began’, i.e. only since ~1850, when a reliable global thermometer network existed. 2017, 2018 and 2019 were all cooler. (NB no volcanic mega-eruption since 1991). Yet CO2 is still rising. So every passing day that isn’t ‘warmest ever recorded’ for that date at multiple sites worldwide is awkward for the IPCC.
14) The breathtakingly elegant and simple ‘Svensmark Theory’ says rising solar-magnetic output, by deflecting more cosmic rays, reduces cloudiness. This allows more of the Sun’s warmth to heat the ocean and hence the atmosphere (Bullet 5A), instead of being reflected back out into space by clouds. In support, a NASA study of satellite data spanning 1979-2011 (during the ‘Modern Warming’; Bullet 12) showed decreasing cloud cover. The IPCC dismisses Svensmark’s theory.
15) Vocal climate scientist, computer modeller, IPCC lead author, and recipient of a 1999 US$1 million private donation to work on his alarming idea that man-made warming might stop “Atlantic conveyor belt” ocean circulation, with dire consequences for regional climate (cooling), ecosystems and society, Stefan Rahmstorf (Wiki) of the Potsdam Institute for Climate Impact Research wrongly said in 2008: “there is no viable alternative … [to CO2 as driver of 1940-2005 warming, as] … different authors agree that solar activity did not significantly increase”. Yet in 1999, physicist Dr Michael Lockwood FRS (Wiki) and co-authors wrote in prestigious Nature journal that from 1964 to 1996 “the total magnetic flux leaving the Sun has risen by a factor of 1.4” and from 1901 to 1992 by 2.3! Supporting Lockwood’s work, Steinhilber et al. (2010) showed that “Since the year 1700, the open solar magnetic flux has increased by about 350%”.
16) Lockwood (Bullet 15) showed that averaged solar magnetic flux increased 230% from 1901 to 1995, i.e. more than doubled. The ongoing (ocean-lagged) warming that followed the 1945-75 cooling (Bullet 5) was driven by this solar surge, via the Svensmark effect (Bullet 14), delayed by ‘ocean memory’ (Bullet 21), which will ensure continued warming for several more decades. Bullets 17 and 18 also support Svensmark’s theory.
17) After the ~300AD solar Grand Maximum (Bullet 12), between 350 and 450 global average temperature warmed to near today’s value. Subsequent ‘sawtooth’ cooling mimicked the Sun’s 1,000-year sawtooth decline into the Little Ice Age (Bullet 9).
18) In the ‘Holocene Climatic Optimum’ (Bullet 20) spanning 8,000 to 2,000BC, Earth was warmer than now except for about five interludes of a few decades each. Unsteady cooling from 3,000BC to the Little Ice Age (Bullet 9) paralleled unsteady solar decline.
19) This 4,500-year-long cooling mocks IPCC computer models that instead predict warming by the simultaneous (slow) rise in CO2. This is the ‘The Holocene Temperature Conundrum’ of Liu et al. (2014). See also Bullet 6.
20) Embarrassingly for the IPCC, the 8000-2000BC warm interval (Bullet 18) was already called the ‘Holocene Climatic Optimum’ (Wiki) before IPCC’s ‘CO2 = pollutant’ fallacy induced today’s AGW hysteria and pointless multi-trillion-dollar climate-change industry. The warmth may have benefited development of human civilisations.
21) For at least the last 1,700 years, sawtooth-style global warming/cooling correlate well with solar-magnetic activity (Bullet 12) by applying an ‘ocean-memory’ lag of 60-160 years (varying with time), attributable to oceanic thermal inertia (vast ocean volume, high heat capacity and slow circulation/mixing; Bullet 6), causing delayed response to changes in solar-magnetic flux, hence cloudiness, which governs global temperature (Bullet 14).
22) The IPCC says ongoing global warming despite solar weakening (since 1991; Bullet 12) disqualifies the Sun as the cause of warming. This disingenuously ignores the time-lag caused by oceanic thermal inertia, of which the IPCC is well aware, and which brings the Sun’s past ‘ups-and-downs’ (‘sawteeth’) into alignment with global temperature ups-and-downs (Bullet 12). Thus one of only three pillars upon which the ‘Anthropogenic (man-made) Global Warming’ dogma stands is demolished. The other two, namely (i) simultaneous warming and acceleration in CO2 since 1850 (a chance coincidence; Bullet 24), and (ii) the 30cm sea-level rise since 1850 supposedly unprecedented in 2,000 years (Bullet 26), are equally easy to dismiss.
23) The last interglacial period, ~120,000 years ago, was warmer than our Holocene interglacial. Humans and polar bears survived! CO2 was then about 275 ppm, i.e. lower than now (Bullet 8), at a time of greater warmth!
24) The joint rise of temperature and CO2 is a ‘spurious correlation’, mere chance. Earth’s temperature correlates much better with solar output, which increased just as impressively in the 20th Century (Bullet 12). So IPCC’s demonising of CO2 as a ‘pollutant’ is a colossal blunder, costing trillions of dollars in needless and ineffectual efforts to reduce it. Instead, governments need to focus urgently on the imminent metre-scale Sun-driven sea level rise.
25) Although the Sun is now declining since its 1991 magnetic peak (Bullet 12), solar-driven global warming will continue until ~2050 due to ‘ocean-lag’, presently ~60 years (Bullet 21). Meanwhile rising CO2 will continue to raise global food production (Bullet 8), without affecting climate (Bullet 5). Cooling will begin ~2050 and last at least 28 years (i.e. post-1991 solar-magnetic decline to date). Sadly our benign Holocene ‘interglacial’ period will eventually end, inevitably, by Milankovitch orbital forcing (Bullet 12), much more powerful than solar changes.
26) IPCC says sea level (SL) from 0 to 1800AD varied < 25 centimetres (and < 1 metre since 4000BC) and never exceeded today’s SL, therefore the 30-centimetre SL rise measured since 1850 is abnormal, they say, blaming industrial CO2. But this claim, based on flawed cherry-picked evidence, ignores dozens of studies of geological and archaeological 3000BC-1000AD SL benchmarks globally, which reveal 3 or 4 rises (and falls) of 1-3 metres in 5 millimetres/year), all reaching higher than today, long before industrial CO2.
27) If humans were to stop expanding fossil-fuel use and maintain current levels, CO2 would soon stabilise at a new equilibrium value, nearer the optimum for plants (Bullet 8). When fossil fuels eventually become too scarce to produce economically, and we switch inevitably to nuclear energy, CO2 will decrease.
28) NASA’s ‘ClimateKids’ website says “Extra greenhouse gases in our atmosphere are the main reason that Earth is getting warmer” and “today the planet is warming much faster than it has over human history.” The first statement is untrue (see many Bullets above). The wording of the second statement, which may or not be true, gives the impression that man is to blame, and omits to mention that the Sun’s increase in output from the Little Ice Age (Bullet 9) to the 1991 solar-magnetic peak was the greatest for at least the last 9,000 years (Bullet 12). Society is in a sad state when even NASA, who put men on the moon, is reduced to uncritically jumping on the AGW bandwagon/gravy train and scaring children with a fairy tale (i.e. first statement above) affecting their mental health (see also Bullet 8).
29) In March 2020 I exposed Wikipedia’s November 2019 deletion of its ‘List of scientists who disagree with the scientific consensus on global warming’ (Bullet 4), which named 79 renowned PhD scientists (each with his/her own Wikipedia entry), from diverse sciences, brave enough to publicly challenge the global CO2 madness. (Tens of thousands of other ‘skeptical’ scientists are sadly too timid to join in, frightened for their jobs.) Thus, your children may never know that many prominent, impartial scientists disagree with the claim by the under-qualified (Bullet 1), disingenuous (Bullets 6, 22) IPCC that global warming is due to man-made CO2. This is global censorship by ‘Tricky Wiki’. Fortunately the list survives, both hard-copy (contact me for pdf) and online (for now).
30) Dismissing Modern Warming’s clear correlation with 20th-century rising solar activity based on sunspots (especially after applying a time-lag of ~60-100 years; Bullets 12, 21), the Royal Observatory of Belgium’s SILSO group (connections to IPCC) produced a “corrected” new sunspot series, now widely accepted, greatly inflating the 1778 sunspot peak, so that the 1958 peak (Bullet 12) looks much less exceptional. The result was announced in a 2015 press release by SILSO Director Frédéric Clette: “The new record has no significant long-term upward trend in solar activity since 1700, as was previously indicated. This suggests that rising global temperatures since the industrial revolution cannot be attributed to increased solar activity.” Voilà ! How pleased must the IPCC have been? My Technical Note 2019-17 shows the “correction” to be incorrect.
31) The NASA and HadCRUT graphs (Bullet 11) show global land surface air temperature rising faster than sea surface temperature since 1985. Land and sea warming from 1985 to 2016 was supposedly 1.2 and 0.5 centigrade degrees, respectively (NASA), i.e. the land warmed more than twice as fast! This divergence is highly doubtful, for two reasons: (1) the same graphs show much less divergence before 1985 and sometimes in the opposite sense; and (2) the ocean governs global average air temperature (Bullet 5A), therefore how can the latter warm more than the former? Computer models blame the divergence on global warming by CO2, but models can produce any desired result (Bullet 6). A far more likely explanation is inadequate land-temperature correction for the ‘urban heat island’ effect. Indeed, there has been massive urbanisation worldwide since 1985, out-of-control world population increasing 60% and urban population more than doubling.
32) The ‘Hockey stick controversy’ (Wiki) refers to Michael Mann’s 1999 temperature graph for 1000AD to 1998, shaped like a hockey stick, with its ‘shaft’ and ‘blade’ joining at the Little Ice Age (Bullet 9). Many AGW skeptics and deniers (Bullet 4) accused Mann of fraudulently erasing the warm ‘hump’ of the Medieval Warm Period (MWP) in the previously accepted temperature graph for 900 to 1950AD by pioneer palaeoclimatologist and originator of the MWP concept Hubert Lamb (1965), re-published with minor alterations by IPCC itself (Folland et al. 1990), showing the MWP peak ~1150AD, and warmer than today. But Lamb’s graph was only intended as a gross approximation, based mostly on historical documents. In contrast, post-1999 graphs based (like Mann’s) on temperature proxies (tree rings etc.) and extending further back to 1AD, vindicated Mann and confirmed the MWP hump was lower and broader, and started centuries earlier, and was already surpassed by Modern Warming by 2000 or possibly as early as 1950.
33) The IPCC assures us that Earth’s temperature is controlled by CO2 and that the Sun has minuscule or zero effect. This is precisely backwards. In truth, solar-magnetic output controls our climate (Svensmark effect, Bullet 14) and CO2 has little or no influence (Bullets 1, 10, 11, 19, 32). Varying solar output even controls the timing of large earthquakes, making it even harder to believe the IPCC’s claim that the Sun might not affect climate.
CONCLUSION
These 33 bullets collectively prove that any CO2 effect on global temperatures of the Holocene period (i.e. the last 11,650 years), including the ‘Modern Warming’ period since 1815, was nil or too small to detect. Almost certainly CO2’s greenhouse effect is nullified by negative-feedback effects greatly underestimated by the IPCC. This explains ‘The Holocene Temperature Conundrum’ and why ‘runaway’ warming is unknown throughout geological history. Holocene temperature changes were instead driven by solar-magnetic changes (controlling cloudiness via the Svensmark Theory), superimposed on long-term cooling due to Earth’s declining axial obliquity.
I, Dr Higgs, predict another few decades (to about 2050) of ocean-lagged Modern Warming by the Sun’s 20th-century surge, offset by CO2’s net (including feedbacks) cooling effect, while CO2 climbs nearer the optimum for plant photosynthesis. Then Sun-forced cooling will begin. There is no ‘climate emergency’. There has never been a better time to be alive. Be happy.
Dr Roger Higgs (DPhil geology, Oxford, 1982-86)
Geoclastica Ltd and ResearchGate”
Bronnen:
https://electroverse.net/33-bullet-points-proving-global-warming-is-caused-by-the-sun-not-co2/
33 bullet points prove global warming by the Sun, not CO2: by a GEOLOGIST for a change
https://www.researchgate.net/publication/332245803_33_bullet_points_prove_global_warming_by_the_Sun_not_CO2_by_a_GEOLOGIST_for_a_change
Higgs 2019 (updated 2021) CO2 bullet points & SOURCES.pdf
https://www.researchgate.net/publication/334029086_Higgs_2019_updated_2021_CO2_bullet_points_SOURCESpdf
According to the Satellites, Earth has Cooled Rapidly during the past 2 Months
https://electroverse.net/earth-cooled-rapidly-over-the-past-2-months/
Historic Arctic Blasts are about to Engulf North America, Europe, and Asia Simultaneously: Grand Solar Minimum
https://electroverse.net/historic-arctic-blasts-are-about-to-engulf-north-america-europe-and-asia/
De angstopwekkende meme ‘klimaatverandering’ is feitelijk burgerbedrog
https://www.climategate.nl/2021/01/94685/
Adaptatie – een oase van ratio
https://www.climategate.nl/2021/02/adaptatie-een-oase-van-ratio/
Václav Klaus : parallellen tussen communisme en klimaatbeleid
https://www.climategate.nl/2021/02/vaclav-klaus-parallellen-tussen-communisme-en-klimaatbeleid/
Mark Rutte de socialist – Build Back Better
https://video.wakkeren.nl/videos/watch/8ade92f2-9c76-4008-a874-b90864c38ee8
Robert F. Kennedy Jr. Pens Encyclopedic Account Of Bill Gates’ ‘Neo-Feudalism’
‘It’s baffling to me how so many of my friends in the environmental movement have swallowed Gates’ dystopian plans for humanity’
https://summit.news/2021/02/08/robert-f-kennedy-jr-pens-encyclopedic-account-of-bill-gates-neo-feudalism/
Bill Gates and Neo-Feudalism: A Closer Look at Farmer Bill
Bill Gates has quietly made himself the largest owner of farmland in the United States. For a man obsessed with monopoly control, the opportunity to also dominate food production must seem irresistible.
https://childrenshealthdefense.org/defender/bill-gates-neo-feudalism-farmer-bill/
“Europees Parlement neemt laatste horde voor uitkering coronamiljarden
…
Ook moet minimaal 37 procent van de uitgaven besteed worden aan maatregelen die de klimaatdoelstellingen dichterbij brengen…”
Bron:
https://www.rtlnieuws.nl/economie/artikel/5213579/eu-herstelfonds-rff-wederopbouw-europees-parlement-akkoord
Berlin On The Brink! Winter Blackouts Loom As Coal Plants Run At 100% Capacity, Struggle To Keep Lights On In
https://notrickszone.com/2021/01/28/berlin-on-the-brink-blackouts-loom-as-coal-plants-running-at-100-capacity-struggle-to-keep-lights-on-in/
Groene Reset: Bill Gates vergelijkt strijd tegen broeikasgassen met ‘wereldoorlog’
https://www.ninefornews.nl/groene-reset-bill-gates-vergelijkt-strijd-tegen-broeikasgassen-met-wereldoorlog/
“NEW – Bill Gates on the global green reset: “It’s an all-out effort, like a world war, but it’s us against greenhouse gases.””
https://twitter.com/disclosetv/status/1361280806652686337
Bill Gates Goes Full Captain Planet, Wants To Change ‘Every Aspect Of Economy’ While We Dine On Fake Meat
https://www.zerohedge.com/political/bill-gates-goes-full-captain-planet-wants-change-every-aspect-economy-while-we-dine-fake
Bill Gates Buying Up Huge Amount of Farmland While ‘Great Reset’ Tells Americans Future is No Private Property
https://summit.news/2021/01/15/bill-gates-buying-up-huge-amount-of-farmland-while-great-reset-tells-americans-future-is-no-private-property/
Robert F. Kennedy Jr. Pens Encyclopedic Account Of Bill Gates’ ‘Neo-Feudalism’
https://summit.news/2021/02/08/robert-f-kennedy-jr-pens-encyclopedic-account-of-bill-gates-neo-feudalism/